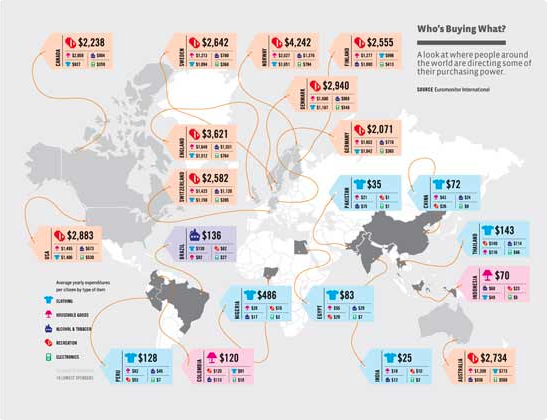
1. The purpose of this infographic is to show a graphical representation of consumer spending across the globe.
2. This infographic has all the 5 attributes of CHART. There is contrast with the map being a neutral color and the price tags being a brighter color. There is hierarchy with the most biggest item in each price tag being highlighted by being visually bigger and a color that represents it. There is accuracy with information online being similar to the information on the infographic. There is relevance with the information being recent. There is truth with the information coming from a reliable source. 3. Comparing PC to Mac, How to build a desktop PC, Steps to creating a good infographic
0 Comments
Leave a Reply. |
AuthorMy name is Aidan AuYeung. Archives
April 2023
Categories |
 RSS Feed
